
Center for Atmospheric And Climate Sciences
Indian Institute of Technology Madras

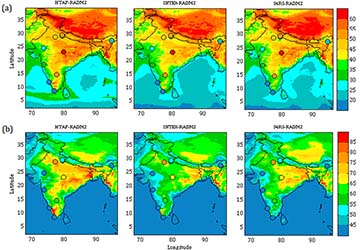
Figure 1 : Monthly (April) average surface ozone calculated for (a)24 h and (b) noontime (11:30–16:30 IST). The average ozone mixing ratios (ppbv) from observations are also shown for comparison on the same colour scale. Note the difference in colour scales in the top and bottom rows.
Description of work : Wrf-chem was a regional atmospheric chemistry model used to simulate ozone and trace gases.
Works /publications : WRF-Chem simulated surface ozone over south Asia during the pre-monsoon: effects of emission inventories and chemical mechanisms
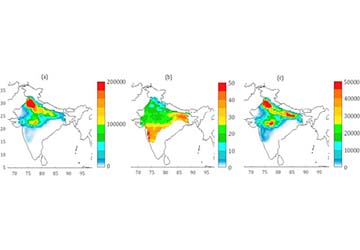
Figure 2 : (a) Total Wheat production (Rabi growing season) in tonnes/model grid; (b) Percentage relative yield loss (%RYL); and (c) Crop production loss (CPL) for wheat in tonnes/model grid in each model grid.
Description of work :Wrf-chem was a regional atmospheric chemistry model used to simulate ozone and trace gases.
Works /publications : Revisiting the crop yield loss in India attributable to ozone
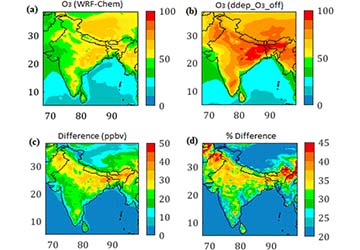
Figure 3 : Distribution of simulated mean surface ozone (ppbv) (a) in reference simulation WRF-Chem, (b) in ddep_O3_off simulation; (c) difference between (b,a); (d) percentage difference between (b,a) with respect to (b) for April 2013.
Description of work :Wrf-chem was a regional atmospheric chemistry model used to simulate ozone and trace gases.
Works /publications : Effects of Dry Deposition on Surface Ozone over South Asia Inferred from a Regional Chemical Transport Model
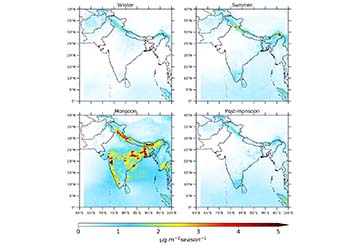
Figure 4 : seasonal variation of Hg wet deposition from 2013-2016*
Description of work : GEOS-chem was a global atmospheric chemistry model used by the research groups worldwide to simulate oxidant-aerosol system
Works /publications : Modelling of atmospheric mercury in India
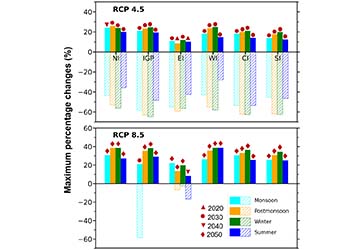
Figure 5 : Maximum percent change in projected seasonal mean of biomass burning during 2020-2100 releative to 2010 over 6 regions under RCP4.5 and RCP8.5.*
Description of work : GEOS-chem was a global atmospheric chemistry model used by the research groups worldwide to simulate oxidant-aerosol system
Works /publications : seasonal variation of AOD under RCP scenarios over India: Implication of biomass burning
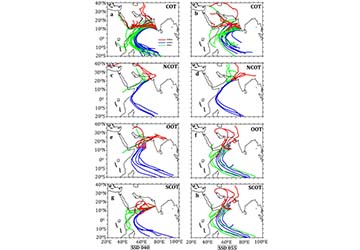
Figure 6 : (a) Total7-days of back trajectory (at different heights) analyses in different transects during the sample collecting period.
Description of work : Box models and receptor models like HYSPLIT/STILT were used
Numerical Modelling of the Atmosphere
Opposite trends in heat waves and cold waves over India
Abstract
Extreme weather events have increased notably in recent decades, including heat waves and cold waves resulting from extreme temperature conditions near the surface. Using India Meteorological Department (IMD) data from 1970 to 2019, we studied heat wave and cold wave trends across India's four climatic zones. Our findings revealed opposing patterns: heat wave frequency increased by approximately 0.6 events per decade, while cold wave frequency decreased by about 0.4 events per decade. Although northwest India remains highly vulnerable to heat waves, central peninsular India has also experienced more frequent occurrences. The duration of cold waves decreased in montane, arid and semi-arid, and tropical wet and dry regions, but the subtropical humid zone saw an increase in cold wave frequency. Comparing IMD observations with CMIP6 models, the models struggled to accurately capture the spatial features of heat wave and cold wave trends. Consequently, caution should be exercised when using CMIP6 model output to predict future changes in frequency. These findings highlight the need for a better understanding of these extreme events at a process-level.
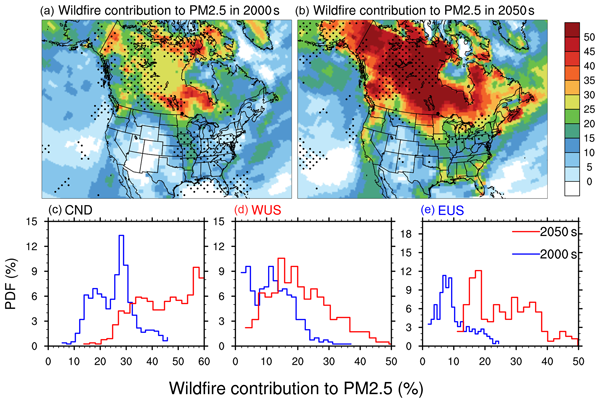
Projected increases in wildfires may challenge regulatory curtailment of PM2.5 over the eastern US by 2050
Abstract
The anthropogenic contribution to fine particulate matter (PM2.5) concentrations has sharply declined in North America, but there has been a concerning increase in air pollution events caused by wildfires due to recent warming. Based on model simulations, we project that summertime wildfire-induced PM2.5 concentrations in North America will almost double by the mid-21st century compared to present levels. Particularly noteworthy is the significant impact in the eastern US, where fire-induced PM2.5 is expected to contribute approximately 15% to 20% of the total PM2.5, with levels increasing by approximately 1-2 µg/m³. This is attributed to the transport of smoke from future wildfires in North America to the eastern US, accompanied by positive climatic feedback affecting circulation, atmospheric stability, and precipitation. Consequently, the expected reductions in PM2.5 from regulatory controls on anthropogenic emissions may be substantially compromised in the densely populated eastern US in the future.
The research activities of the Centre have been oriented towards achieving fundamental understanding of the various atmospheric and climatic processes which have immense relevance to society.